Creating Graphs - Week 4
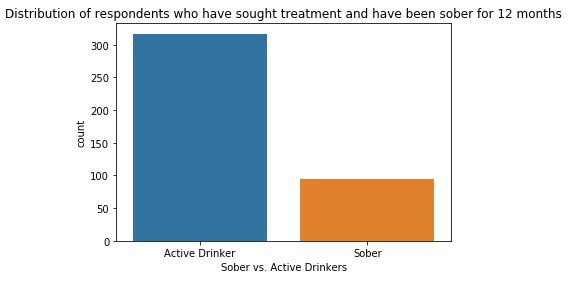
The two variables considered for the research question are graphed below using univariate (count) and bivariate bar charts. They are: Response variable: Active Drinkers vs. Sober Respondents in a subset of the NESARC dataset that is limited to respondents who have sought at least one type of treatment for alcohol dependence. independent variable: Count of distinct types of treatment for alcohol dependence sought by an individual respondent. This univariate bar chart compares the two possible values of the response variable: Active vs. Sober Drinkers. Of the approximately 400 respondents who sought at least one type of treatment for alcohol dependence, about 100, or 25% remained sober for the 12 months prior to being surveyed. This univariate bar chart shows the distribution of the independent variable: the number of distinct treatment types sought per respondent. This variable was computed by totaling the instances across the various types of treatments in...