Creating Graphs - Week 4
The two variables considered for the research question are graphed below using univariate (count) and bivariate bar charts. They are:
This univariate bar chart shows the distribution of the independent variable: the number of distinct treatment types sought per respondent. This variable was computed by totaling the instances across the various types of treatments included in the NESARC survey for each respondent. This numerical total was then converted to a categorical variable.

 The following is a bivariate bar chart compares the independent variable, number of distinct treatment types per respondent, to the response variable, sober vs. active drinkers.
 The chart suggests that the more distinct types of treatment a respondent has sought, the higher the likelihood that they will achieve sobriety. The chart uses the individual values, which resulted in a skewed distribution. The following chart shows a similar bivariate comparison between the response variable and the groupings of distinct treatment type counts.
 The relationship is similar to the ungrouped chart, though the proportion of sober respondents in the high treatment counts categories is lower -- as would be expected given the spread of values among the 9, 11, 12, 13 & 14 values.
Both bivariate charts suggest what appears to be a strong positive correlation between number of distinct treatment types and achieving sobriety.
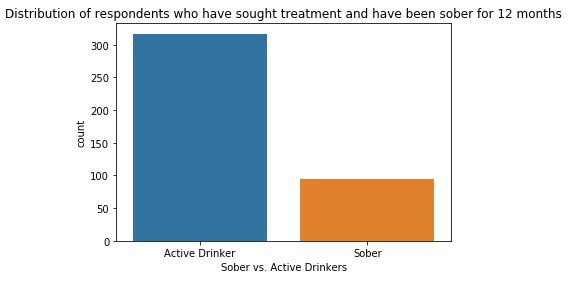
- Response variable: Active Drinkers vs. Sober Respondents in a subset of the NESARC dataset that is limited to respondents who have sought at least one type of treatment for alcohol dependence.
- independent variable: Count of distinct types of treatment for alcohol dependence sought by an individual respondent.

This univariate bar chart shows the distribution of the independent variable: the number of distinct treatment types sought per respondent. This variable was computed by totaling the instances across the various types of treatments included in the NESARC survey for each respondent. This numerical total was then converted to a categorical variable.

The distribution is skewed right (long
tail on the high side) so the values were then grouped in ways that
approximate a normal distribution as shown in the chart below. The number of treatment types peaks at 2, then gradually trails off until 8. Values greater than 8 represent much smaller counts than the lower values. To account for this the last treatment count category includes 5 treatment count values (9, 11, 12, 13 & 14).


Both bivariate charts suggest what appears to be a strong positive correlation between number of distinct treatment types and achieving sobriety.
Comments
Post a Comment