Posts

Creating Graphs - Week 4
Image
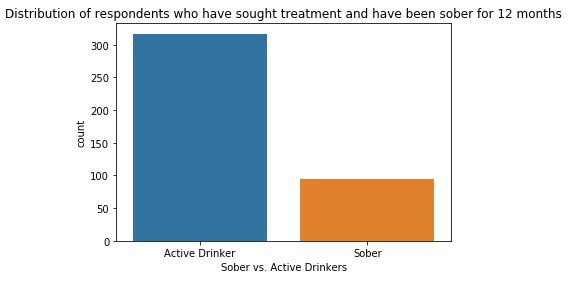
The two variables considered for the research question are graphed below using univariate (count) and bivariate bar charts. They are: Response variable: Active Drinkers vs. Sober Respondents in a subset of the NESARC dataset that is limited to respondents who have sought at least one type of treatment for alcohol dependence. independent variable: Count of distinct types of treatment for alcohol dependence sought by an individual respondent. This univariate bar chart compares the two possible values of the response variable: Active vs. Sober Drinkers. Of the approximately 400 respondents who sought at least one type of treatment for alcohol dependence, about 100, or 25% remained sober for the 12 months prior to being surveyed.     This univariate bar chart shows the distribution of the independent variable: the number of distinct treatment types sought per respondent. This variable was computed by totaling the instances across the various types of treatments included in

Program for Making Data Management Decisions

The following program creates a subset of the NESARC dataset that limits respondents to those who have had episodes in which they continued to drink to feel an effect and who were between 18 and 39 years old at the time of the survey. This subset is then used to identify respondents who have sought and received treatment for alcohol dependence. The variables include: Age & Sex of respondents Responses to questions on the type of treatment sought/received A variable was created to sum the number of different types of treatments respondents sought. Another variable was derived from that to indicate whether a respondent had received any type or treatment or not. Response values that did not indicate a yes or no to a question on treatment type were converted to NaN. Frequency counts and percentage distributions were computed for: Age Age Group Sex Number of treatment types sought Categories of number of treatment types sought Whether treatment of any kind was sought Thi

First Program

 Assignment for Week 2: First Program Code : # -*- coding: utf-8 -*- """ Created on Sat Jul  6 10:48:29 2019 @author: gdeal """ # program to import nesarc dataset limited to respondents who ever needed to drink more to get the intended effect import pandas import numpy # option to avoid runtime errors/warnings pandas.set_option('display.float_format',lambda x: '%f'%x) # read in full nesarc dataset nesarc_df=pandas.read_csv('nesarc_pds.csv',low_memory=False) # convert variable names to upper case nesarc_df.columns=map(str.upper,nesarc_df.columns) # show number of observations and columns in base dataset # print(len(nesarc_df)) # print(len(nesarc_df.columns)) # print("printing values of sex for subset S2BQ1A2") # count_test = nesarc_df['S2BQ1A2'].value_counts(sort=False) # print(count_test) nesarc_df['S2BQ1A2'] = nesarc_df['S2BQ1A2'].convert_objects(convert_numeric=True) nesarc_df['AGE']

Data Analysis: Research Question

My Research Question : I am interested in exploring the relationship between successful outcomes for young adults in alcohol dependence treatment programs and the stability and support of their family environments. I know, and in some cases am related to, people who have become addicted to alcohol. Some have fared better than others in treatment and I would like to try to better understand the reasons why. My Secondary Question : In addition to the stability and support of an alcohol substance abuser's family, I'm interested in whether the person's education and income level have a bearing on how well they do in treatment, and ultimately recovery. My Dataset : I have selected the NESARC (the National Epidemiological Survey of Drug Use and Health) dataset which is a survey based resource that contains information on substance abuse incidence, treatment and recovery. My Codebook : I have created a subset of the NESARC codebook (attached) which contains the sect